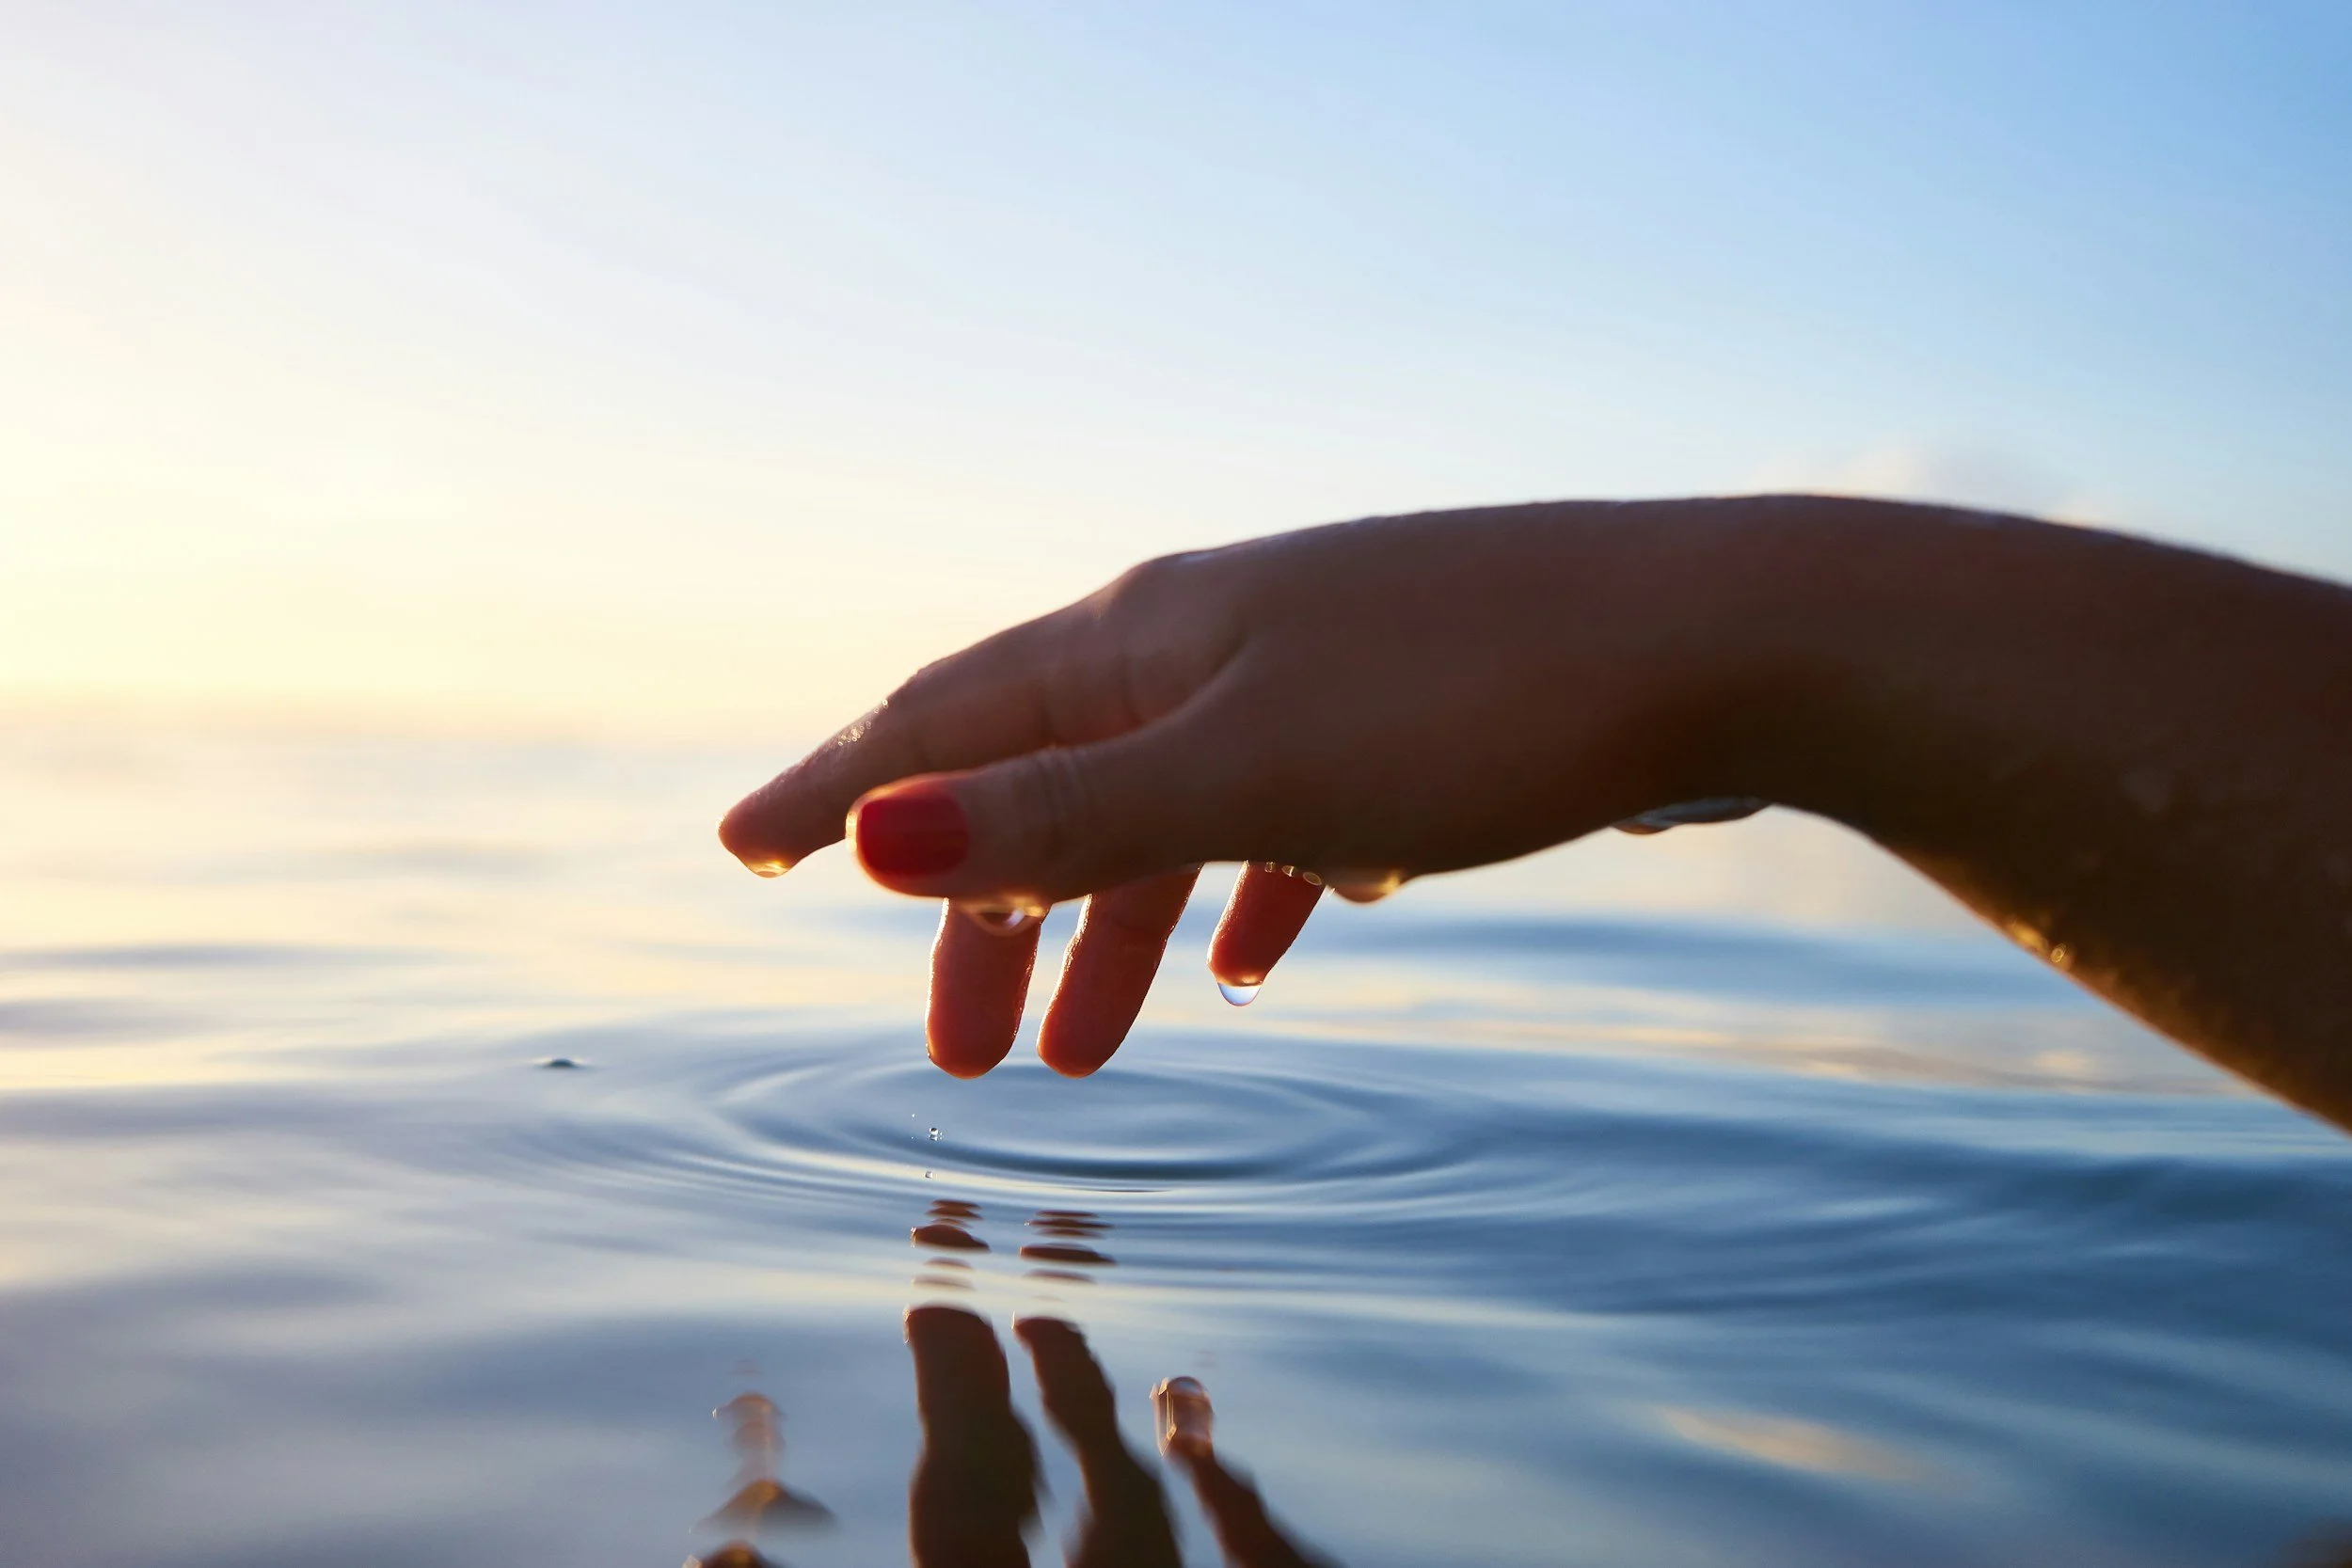
Water World
Changing the world - One drop at a time
The challenge:
I was assigned to create a mobile app to raise awareness about water shortages and promote water conservation, even for those living in areas with abundant water.
Main goal:
Develop an app that helps conserve water.
-
Empathize
-
Define
-
Ideate
-
Prototype
-
Testing
Empathize
Introduction
For many people living in our part of the world, water scarcity has never been a concern. In Norway, we have such an abundance of water that, until recently, municipalities didn’t even have water meters installed in households. This makes it difficult for people to appreciate how precious water truly is.
In other parts of the world, our extraordinary good fortune might seem like something out of a science fiction movie. Water scarcity is an ever-increasing problem, and even regions that a generation ago had an abundance of water are now suddenly finding themselves facing new realities.
Water scarcity refers to the insufficient freshwater resources available to meet the human and environmental demands of a given area. It is inextricably linked to human rights, and ensuring sufficient access to safe drinking water remains a priority for global development.
However, due to challenges such as population growth, excessive use, increasing pollution, and changes in weather patterns caused by global warming, many countries and major cities worldwide—both wealthy and poor—are facing growing water scarcity in the 21st century.

“The children who have no clean water to drink, the women who fear for their safety, the young people who have no chance to receive a decent education have a right to better, and we have a responsibility to do better. All people have the right to safe drinking water, santitation, shelter and basic services.”
— Ban Ki-moon, Former UN Secretary General in 2014
Key facts:
In 2017, 71% of the global population (5.3 billion people) used a safely managed drinking-water service – that is, one located on premises, available when needed, and free from contamination. (World Health Organization, 2019)
90% of the global population (6.8 billion people) used at least a basic service. A basic service is an improved drinkingwater source within a round trip of 30 minutes to collect water. (World Health Organization, 2019)
785 million people lack even a basic drinking-water service, including 144 million people who are dependent on surface water. (World Health Organization, 2019)
Globally, at least 2 billion people use a drinking water source contaminated with feces. (World Health Organization, 2019)
Contaminated water can transmit diseases such as diarrhea, cholera, dysentery, typhoid, and polio. Contaminated drinking water is estimated to cause 485 000 diarrheal deaths each year. (World Health Organization, 2019)
By 2025, half of the world’s population will be living in water-stressed areas. (World Health Organization, 2019)
In least developed countries, 22% of health care facilities have no water service, 21% no sanitation service, and 22% no waste management service. (World Health Organization, 2019)
With these daunting tasks affecting the world on local, regional and global levels, how can I take available knowledge and studies and create better awareness for people, communities, governments and corporations? These are some of the questions I will try to answer in this paper.
Research & Planning
I will dedicate this section to gathering research and insights to help me understand the complex nature of water scarcity, waste, and conservation.
Research Goals
The aim of this section of the paper is to demonstrate an understanding of research processes and tools by conducting research on water scarcity. To gather meaningful information and deeper insights regarding the topic, I have based my research on the following objectives:
What could it mean if we run out of water?
How do we use water?
Who is suffering from water shortage?
Why is it so important for us to focus on solving the water crisis?
When is water conservation important?
Are people aware of where we use water?
By first exploring the topic through secondary data, I aim to develop a basic understanding and collect the findings in Airtable. Using my initial affinity mapping, the structure of the surveys will be determined. Findings from the surveys will then be documented in this report.
To utilize several research methods, including data from surveys and a persona in empathy mapping. A conclusion that answers our research objectives is derived from the final processes.
The research goals of the assignment will be achieved by working through these processes independently at this stage. The result will be an increased understanding of the various processes and tools that form the foundation of UX research.
Although I have traveled to 53 countries and spent several years living abroad, including in water-stressed regions, my knowledge of the topic is limited. Therefore, I found it necessary to use generative research. I incorporated this approach into my quantitative research methods and system analysis to collect statistical data, facts, and insights about the topic.
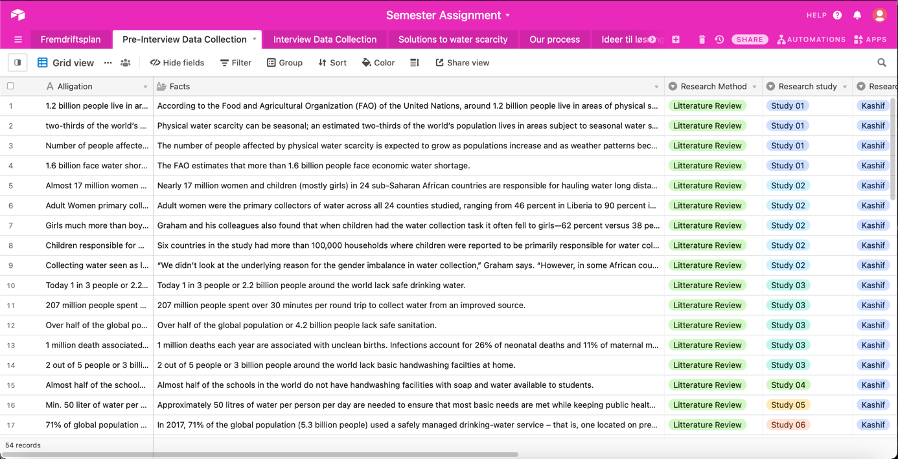
Additionally, I used the online tool Airtable to organize my literature review and prepare for primary data collection.

Secondary Research
In the first phase of the research project, I conducted a digital secondary data collection with a fellow student. We gathered information from reputable organizations, news articles, and even watched two documentaries on the subject. The unbiased facts and useful data we collected were then organized in Airtable to create a structured literature review. You can access the Airtable here: https://bit.ly/39wXxIS
As you can see from the screenshot, we separated our literature review into different studies and numbered them. A total of 25 studies form the basis of this case study.
“Clean water and sanitation were declared by the UN to be a basic human right in 2010”
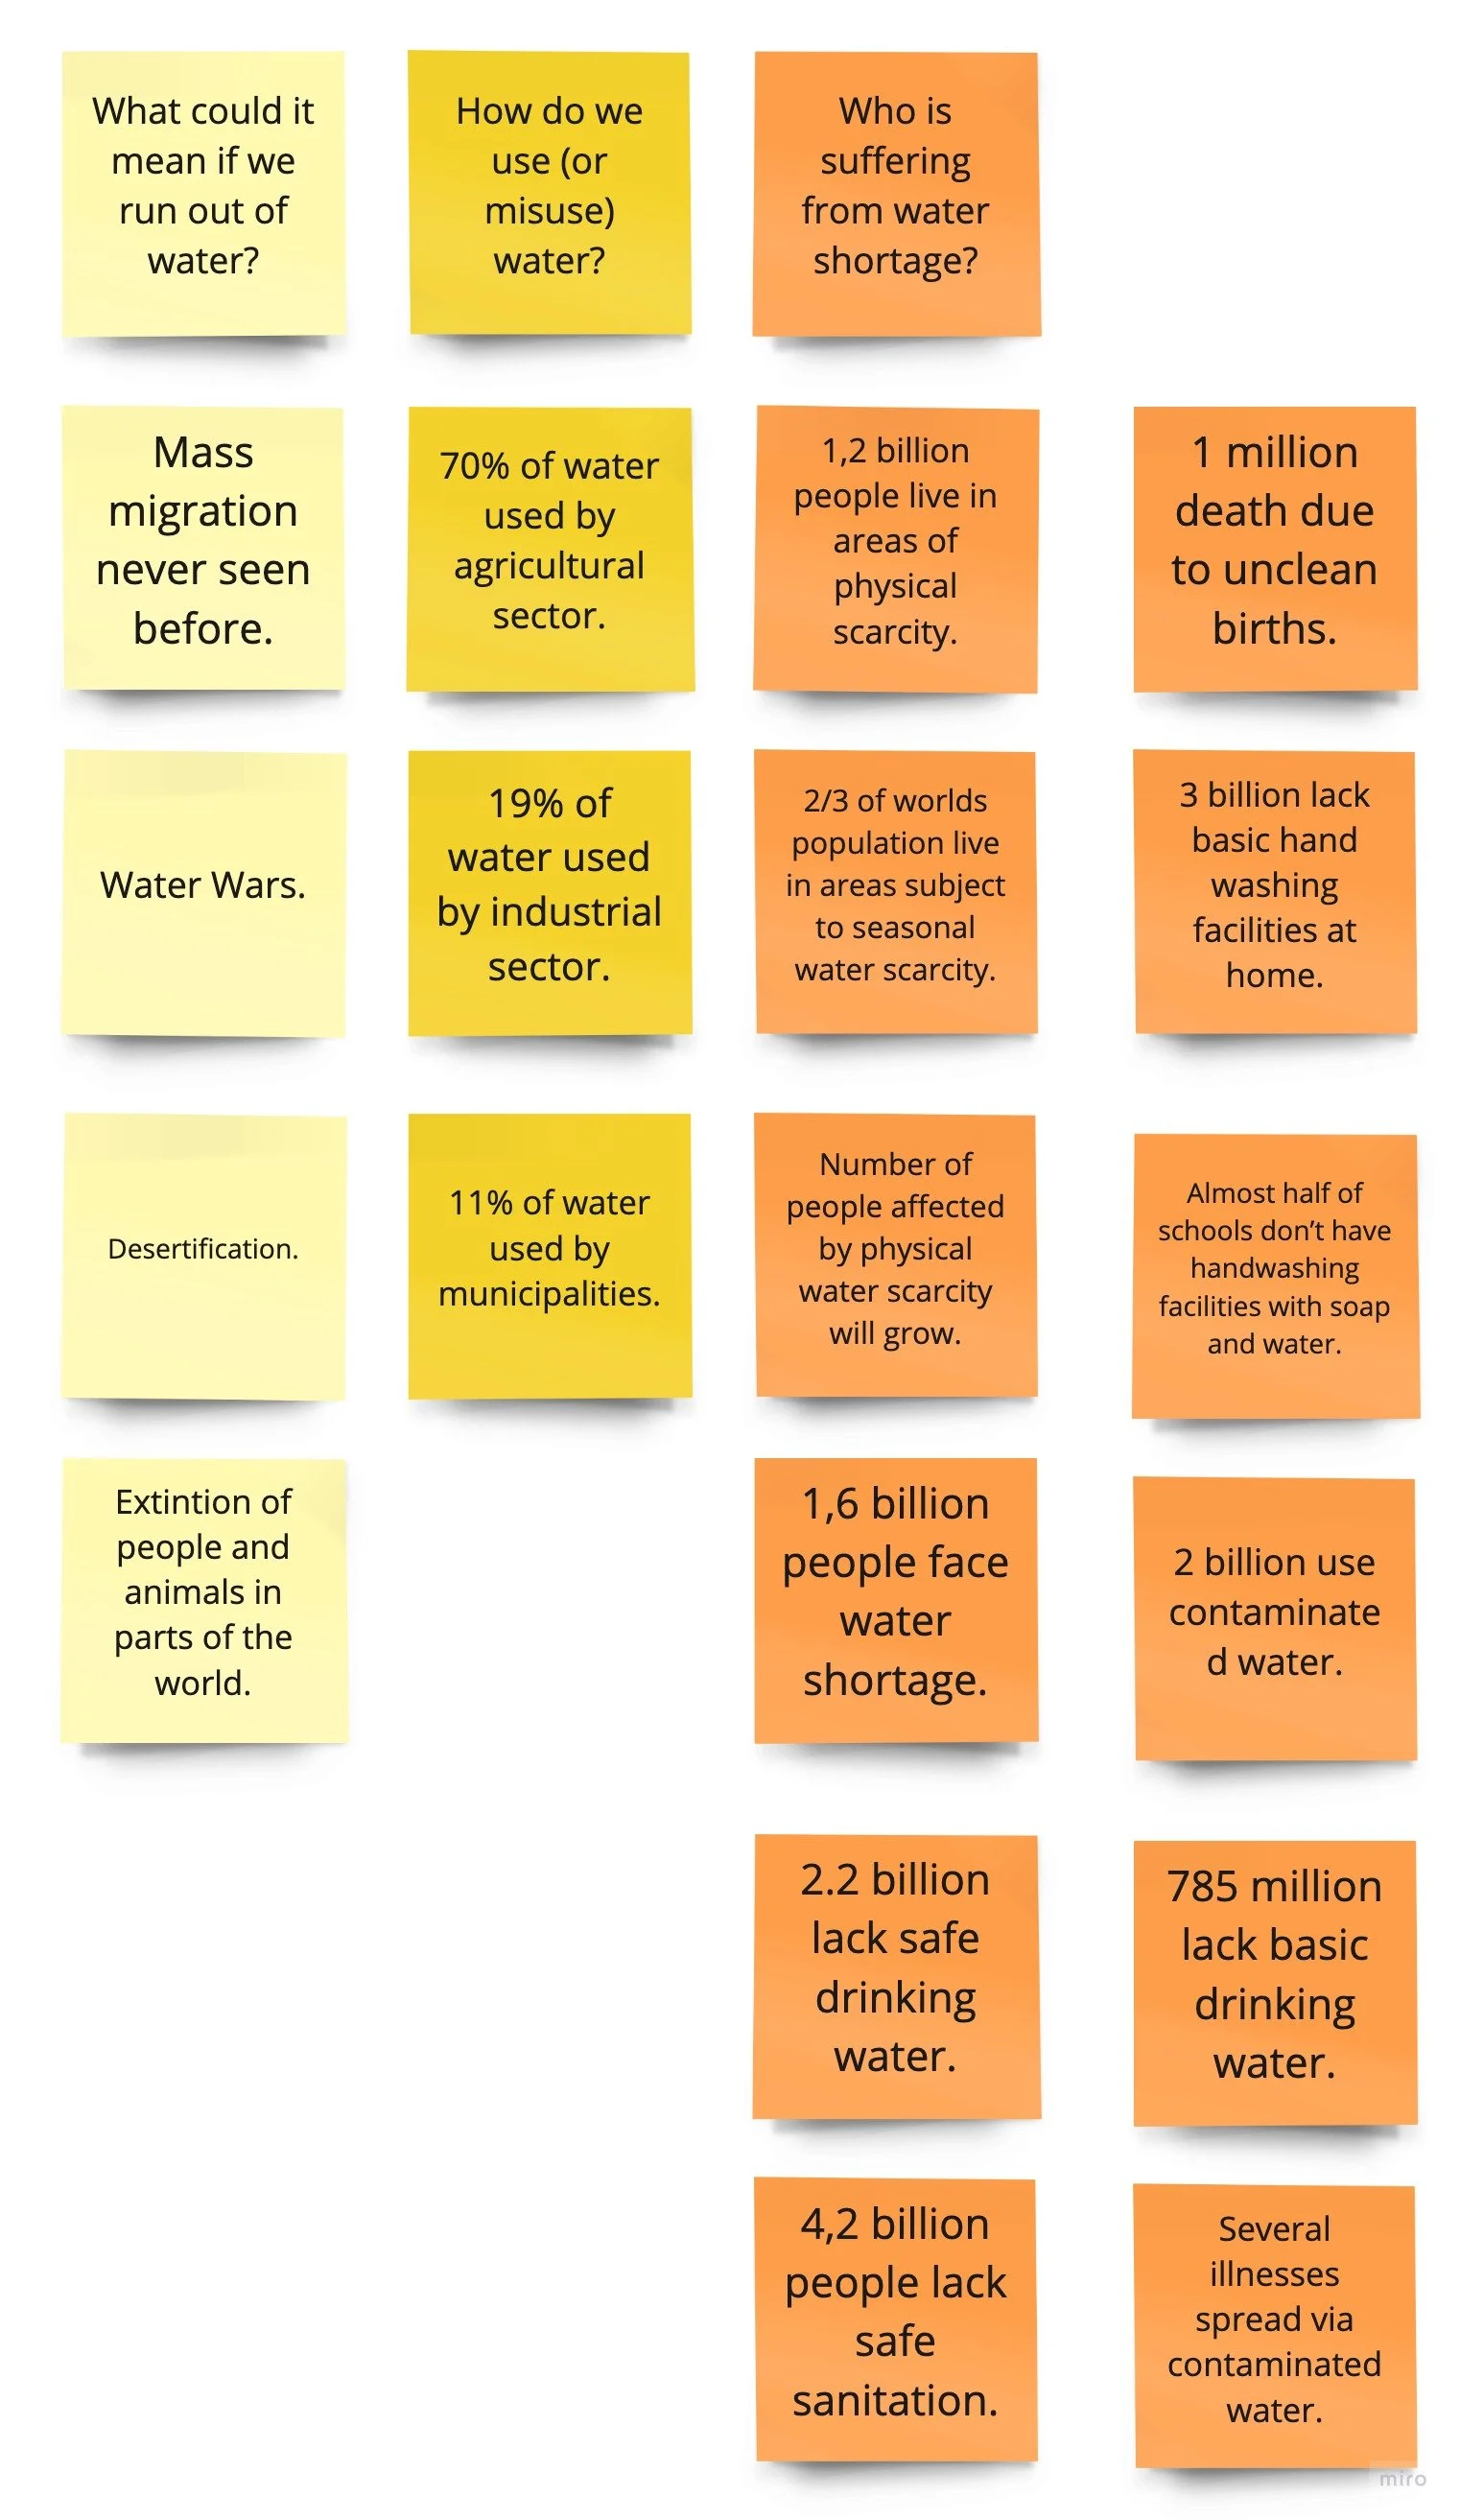
Affinity Mapping
After finishing the process of inputting everything into Airtable, I conducted an affinity mapping session on the wall. During this phase of analysis, we reviewed all the facts, looking for relevant patterns. We then explored this phase of analysis further in the Affinity Mapping lesson.
Affinity mapping is a technique used to turn your facts into meaningful insights. A fact simply tells us what is happening, whereas a meaningful insight explains why or provides a valuable solution. You can access the affinity mapping here: https://miro.com/app/board/o9J_lbH7xFs=/
We used abductive reasoning to interpret facts and uncover insights. We started with a fact and then sought to find the most intuitive and likely explanation. By taking this leap, we connected one or more facts (even if they came from different research methods or studies) to generate an insight.
Conclusion: Secondary Research
As demonstrated in the collected literature review, a significant percentage of the world’s population lives with chronic water scarcity. In 2010, the United Nations declared clean water and sanitation a basic human right (United Nations, 2014), yet ten years later, it remains a significant global issue.
Unfortunately, the international community has not done enough to address this crisis. The lack of access to clean, safe drinking water is closely linked to global climate change and the overconsumption of resources by wealthier nations, far beyond what the Earth can sustain. Looking ahead, Africa’s urban population is projected to triple by 2050 (Hajjar, 2020), and the world’s population is expected to peak at 9.8 billion by the same year (UN, n.d.).
First Primary Research
To begin our primary research, my fellow student and I conducted an initial quantitative survey to gather information: Recruiting screener for water.
In addition to the typical persona questions, we asked the following:
How many countries have you visited?
Have you ever visited a country with water usage restrictions?
Have you ever lived in places for shorter or longer periods without tap water?
How environmentally conscious are you on a scale from 1 to 5 (1 = not very conscious, 5 = very conscious)?
Do you have any dietary restrictions?
What is your social media presence like?
What is your preference when watching TV or streaming?
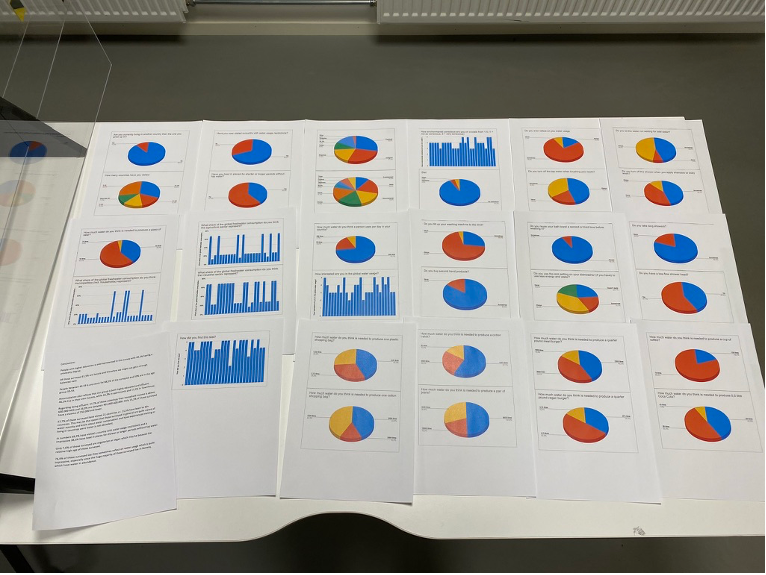
We received 26 responses, and the results were both interesting and somewhat surprising. In my view, the data gathered was valuable for use throughout the project. After analyzing the data, I discussed with my fellow student the idea of skipping interviews and instead sending out a larger survey to collect more comprehensive data. After deliberation, we agreed and proceeded to distribute Survey Number 2: The Big Water Survey.
In this survey, our strategy was divided into two parts:
Part One: Focused on the water usage habits of our participants.
Part Two: Asked participants to estimate how much water is used to produce everyday products and for general water usage.
After gathering all the data, I organized it in a spreadsheet and created diagrams to better understand the underlying patterns and insights.
Findings
All data can be accessed here: https://www.icloud.com/iclouddrive/0yN_ZYPoB1ntokt1mQgnRrqPA#Water_Surveys
From the data collected, we discovered some rather interesting insights:
Education: People with higher education are overrepresented in this survey, with 69.2% holding a university degree.
Gender: Of those surveyed, 61.5% are female, which may result in a somewhat unbalanced perspective.
Age: Participants aged 40–59 account for 88.5% of the survey group, with 50% falling in the 50–59 age bracket.
Accommodation: Reflecting the group’s affluence and education, 46.2% live in houses, 42.3% in apartments, and 11.5% in townhouses.
Income: Regarding household income, 57.7% reported earning above 600,000 NOK, while 26.9% fall between 401,000–600,000 NOK. Only 15.3% have an income of 250,000 NOK or lower.
Travel Experience: A significant 57.7% of respondents have visited over 21 countries, with 11.5% having visited 40+ countries. This may explain the group’s general awareness of water scarcity and conservation, as well as their experience in countries where water is not abundant.
Water Scarcity Experience: 69.2% have visited a country with water usage restrictions, and an impressive 38.5% have lived in places with extended periods of limited access to shower or tap water.
Dietary Choices: Only 7.6% of respondents are vegetarian or vegan, which may be influenced by the relatively high age of the group.
Water Consciousness: A notable 76.9% of respondents say they sometimes reflect on their water usage—impressive given that the majority live in Norway, a country with abundant water resources.
These findings provided valuable insights, but I realized I was still missing some crucial personal data from the users. To address this, I conducted a second round of primary research.
Second Primary Research
Having gathered my initial findings, I decided to gather more personal insights from users through open-ended questions. This method allowed me to better understand the users' needs and opinions. I asked the following six questions:
What was your reaction to the “correct answers” regarding water usage?
In your opinion, what actions could you take to help reduce global water usage?
What do you think can be done on a global scale to reduce water usage?
With reference to the large water usage in industries and agriculture, what actions do you think they can take?
Do you know of any water conservation projects today? If yes, could you mention their main purpose?
Would you be interested in receiving more information about this topic?
To address the imbalance from the earlier surveys, I conducted a quick screener and selected more male participants this time. The final group included five participants:
Gender: 4 male, 1 female
Education Levels: 1 primary education, 1 secondary education, 1 some higher education, 1 bachelor’s degree, and 1 doctorate
Conclusion
In the end, combining a comprehensive literature review, two quantitative surveys, and one qualitative open-ended questionnaire provided sufficient data for us to proceed to the next phase: the ideation and planning stage.

Define
Primary Persona
Personas are hypothetical archetypes of real users. They are made based on user research and help us in designing our products. Primary Persona is the primary user we are developing our product for.
Empathy Map
Analyzing the primary data research and with the knowledge gained by secondary data research I started with empathy mapping to distill the gathered information. You can access the empathy map here: https://bit.ly/2L3U6PJ.
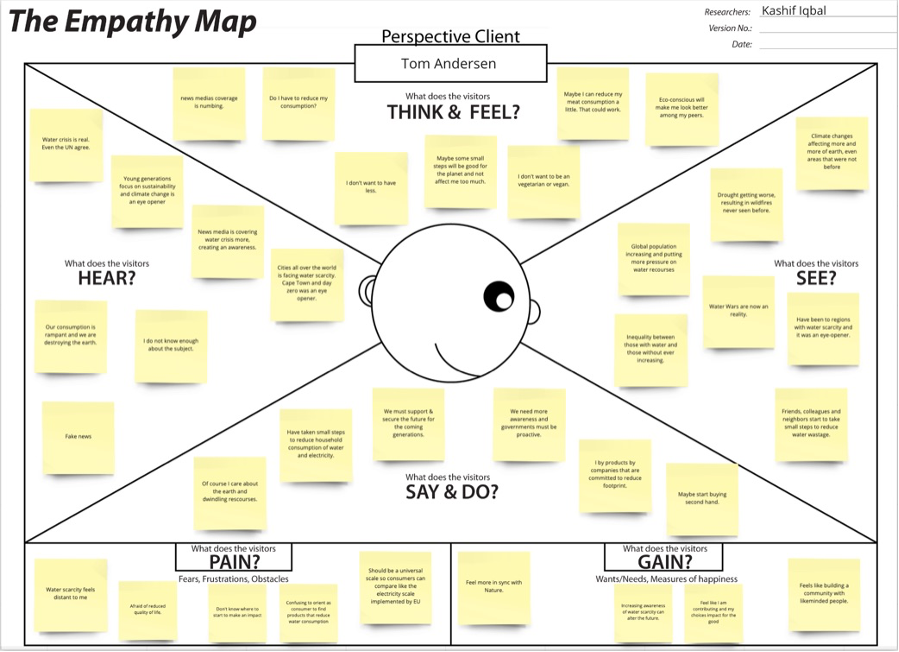

User Persona
As you see here we are now starting to get a good idea of who our primary persona is. He reflects all our user data collected and with empathy and teamwork we can now continue with our ideation and planning.
Tom Andersen: He talks the talk among his friends and colleaugeues but secretly he is a bit afraid of having to lower his life standards.
User Scenario
User scenarios are a way of adding context to a user's life. A scenario is a story about the primary persona, bringing to light
specific events that show how the user may interact with the product in his or her average daily life. The benefits of user scenarios are that they help you understand your user better and gain insight into how they interact with your product.
User Scenario is a great way when you are working on a team. Since I have been working alone on this document, it is a bit more problematic since I cannot ideate with other people, so I will just show you a sample. I went on to use the Goal-Directed Design Method as I feel it is a better method when working alone. You can access the User Scenario here: https://bit.ly/37KbOzx

A scenario is a story about the primary persona, bringing to light specific events that show how the user may interact with the product in his/her average daily life.
The Goal-Directed Design Method
You can write here as much as you want, this text will always look nice, whether you The Goal-Directed Design method is detailed. This method is used to go in-depth with user scenarios and use them to really get to know personas on a detailed level.
This method also allows UX designers to look closer at the behavior of the product in question within a specific context, which is representative of the real world. Throughout the process of user scenario creation, it may become clear that some parts of a product could be more important than others, as a result of the context that it is used in.

Context Scenario
The first level is a context scenario that explores the natural environment that the persona inhabits on a day-to-day basis, as mentioned before. It might, in essence, take a look at the life of, the daily routine of or the primary persona. Researchers might observe where and when the prduct´s presence and usage make an entrance on the scene. Context Scenario can be broken down to a formula as presented by my teacher, David Chong on the left.
For example, in the case of Tom Andersen I have with the formula concluded with these three Context Scenario:
Every weekday morning, Tom Andersen gets a notification by the app to kindly bring a reusable water bottle with him from home.
At lunch time, Tom Andersen gets a daily notification about how much water has saved by accepting challenges form the app.
Tom Andersen gets an invite whenever there is an event in his neighborhood.
Key Path Scenario
The next level is a key path scenario. This type of scenario describes what happens as the persona starts to interact with the product to achieve their goals. It examines how the interaction is experienced by the user. To explain it in plain language you zoom into detail in Key Path Scenario while Context Scenario shows a broader picture.
Let us continue with our Primary Persona Tom Andersen, which we are starting to get to know quite well:
One of the frequent tasks Tom Andersen does is to click «Yes» when asked about bringing his reusable water bottle.
One of the frequent tasks Tom Andersen does is to read the water saving statistics from the app.
One of the frequent tasks Tom Andersen does is to accept an invite when there is a neighborhood event.
Problem Statement and Vision Statement
A good problem statement identifies and highlights the gap between the problem (the unmet user need) and the desired goal (the satisfied user need) of the product. A great defined problem statement will guide you and your team´s work in the right direction. The key to crafting a good problem statement is to focus on the user needs, keep it broad and ensure that it is manageable.
User Needs Statement
Defining problem statements, also known as user need statements or point-of-view statemetns, is a very importnant stage in the process, as it is a tool that defines and aligns the problem you are trying to solve. The benefits of defining your problem is that it captures the user and the need, aligns the teams’ focus on a concise goal and also helps identify a benchmark and measurement for the design or product’s.
Following the formula, I have made the following two user needs statement:
Tom Andersen needs to meet people in the neighborhood to build a community with likeminded people.
Tom Andersen needs to be reminded to bring his reusable water bottle from home.
Tom Andersen needs to get his water saving statistics on a daily basis during lunch.

How Might We?
The next step stemming from defining your POV (point of view) or problem statement is identifying how you can start generating ideas to creatively solve your design challenge by asking “How Might We” questions. Asking HMW questions helps you to prepare for the exploration of ideas that can help you solve your design challenge. HMW questions are the best way to creatively open up brainstorm sessions and other ideation sessions, which is the third stage of the Design thinking process. Again, I am using a formula from my teacher.
Vision Statement
A vision statement is a value proposition of a product that aspires to help relieve the current existing pain points of the user to assist them to easily achieve their goals. You should understand the users’ desired goals and pain points to craft a value-adding vision statement. This vision statement should clearly define the benefits of the product and how to reach their goals. I created both a Vision Statement and a Clean Vision Statement.
“Our App helps people conserve water”
— Vision Statement
“Conserve water”
— Clean Vision Statement
Ideate
Divergent Thinking
Divergent Thinking is the ability to generate creative ideas by exploring many possible solutions in an effort to and one that works. It starts from a common point and moves outward in diverging directions to involve a variety of aspects or perspectives (SparcIT, 2016).
I prepared for the ideation based on my research and experience of designing apps to create a rough plan.
I then worked with the ideas and checked with my previous research & planning and made a first draft with more information:

Worldwide knowledge database
Our app offers a comprehensive knowledge database about water in general, water scarcity, water wastage and water conservation. The user can ask to be notified and get one random fact daily.
“Armed with this information I started preparing before ideation and Convergent Thinking with my friends.”

Mind Mapping
Mind maps are the most simplistic, and thus straightforward type of cognitive maps. They have a clear hierarchy and format, and they are relatively quick to create and consume.
We decided to use Mind Mapping for our case. Mind map is a tree that represents a central topic and its subtopics. I used a whiteboard and drew the map in preparation for my friends to arrive so I could give them a walkthrough and then asked them about their opinion.
Convergent Thinking
Convergent Thinking is the ability to put a number of different pieces or perspectives of a topic together in some organized, logical manner to find a single answer. It involves focusing on a finite number of solutions (SparcIT, 2016).
After the Ideation session with my friends we applied Dot Vote selection and feedback and ideas from them a clearer idea emerged. Here is the Dot Vote.
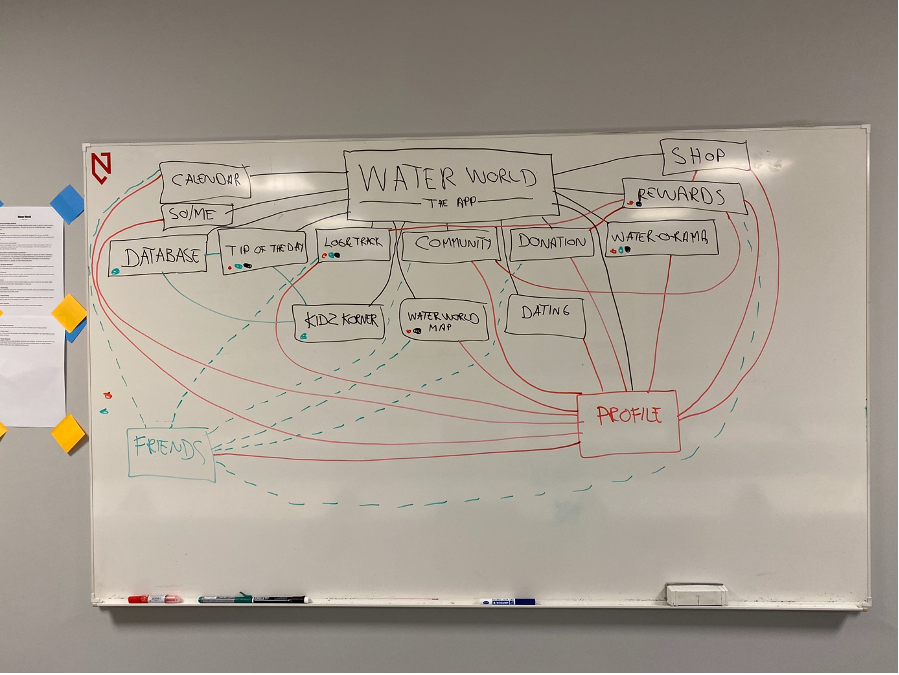
Dot Vote resulted in quite a change of the design. It was clear in talks with my friends that the most wanted features were “Tip of the day”, “Log & Track” and “Water-O-rama” followed by “Water World Map” and “Rewards”.
Some fascinating insight I got from the session:
One of the friends noted that Database and Tip of the day are the same thing, only difference is one is Macro and the other Micro. To remove confusion those two should be merged.
Both pointed out that there is no need to have a community/forum, dating and calendar as these can easily be integrated with Social media sites. Facebook offers all three so why not use Facebook instead.
Another friend noted that Shop, Rewards and Donation really should also be merged as they were complementary to each other and no need to confuse the user with too many niche areas.
In the end we came up with this result seen on the latest photo.

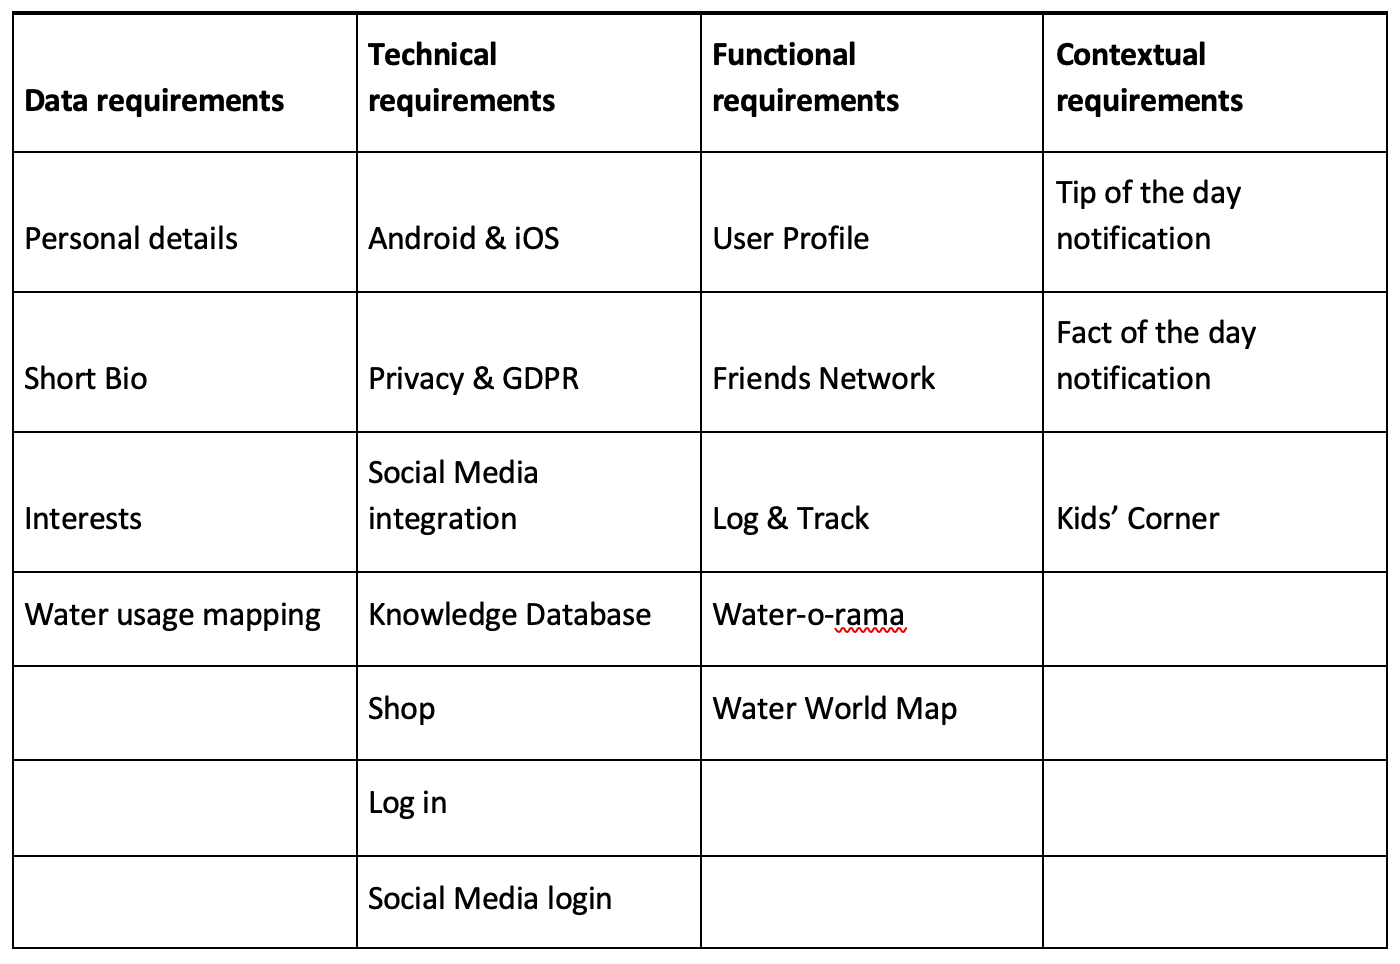
Requirements Definition Process
Armed with information gathered and refined we can now continue to contextualize our requirement and this takes us to framing requirement where we put everything in an easy to read table.
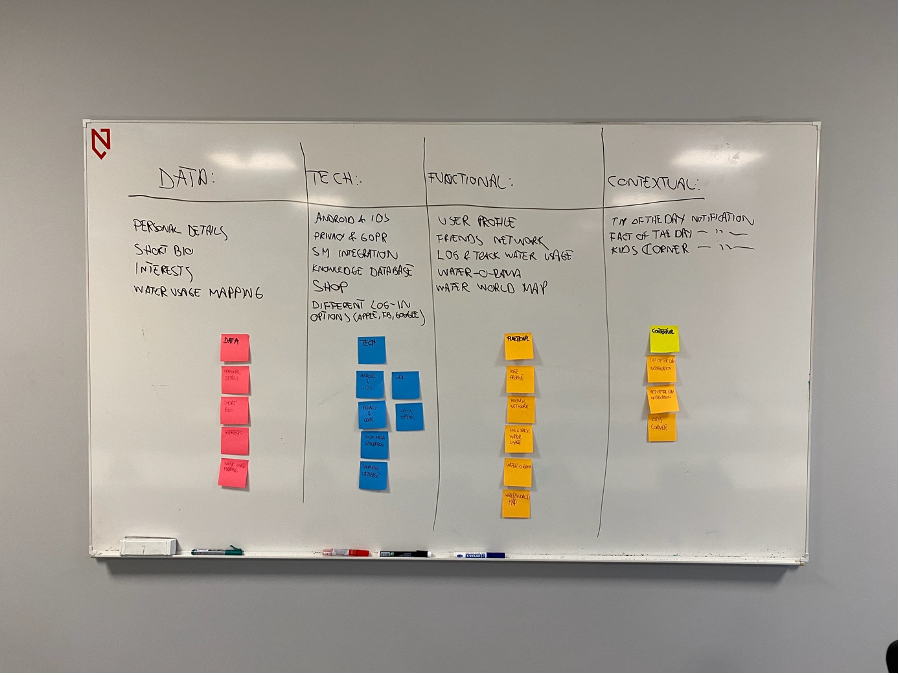
About my way of thinking
For me to visualize and plan ahead working with a project I always ideate with post-it notes as it is then easy to structure both the Requirements Definition Process (Framing Requirement) and later the Information Architechture (IA). They are very related and you can basically re-use all your post-it notes afterwards for the IA. So, I will show you a couple of pictures I have taken while brainstorming this project.
Information Architecture (IA)
After taking the approach in the last step. I quickly used my post-it notes to make a rough Information Architecture. I then took the pictures and started to work on the website “Flow Mapp” to get a full overview of the IA.


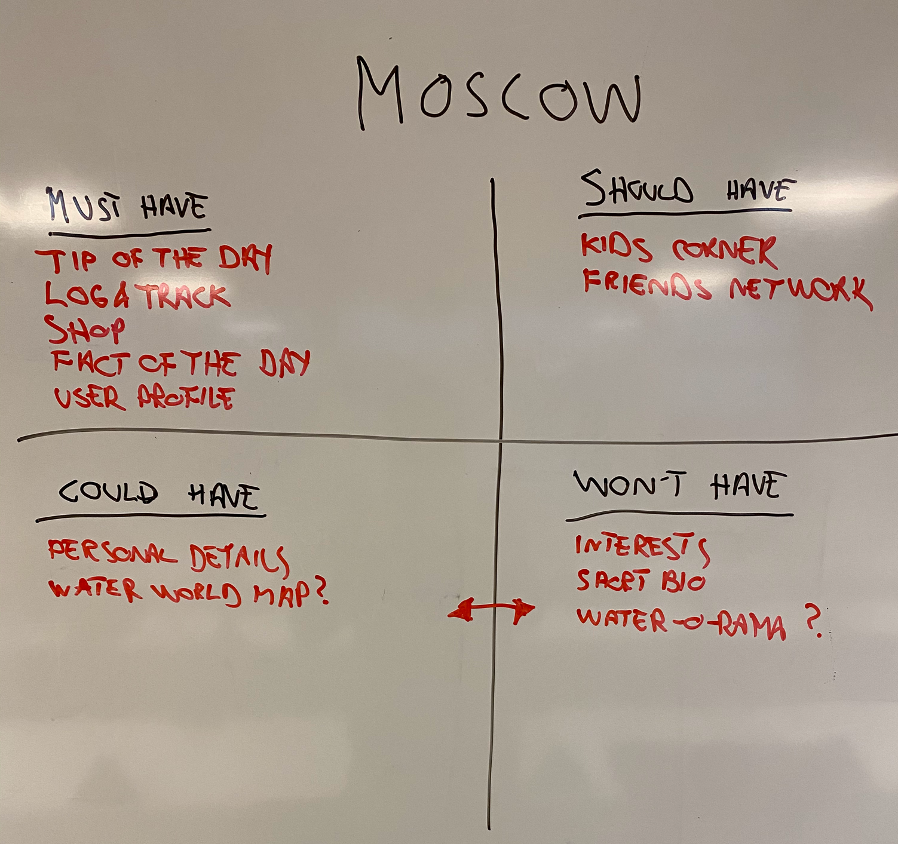
MoSCoW
The MoSCoW method is a prioritization technique used in management, business analysis, project management, and software development to reach a common understanding with stakeholders on the importance they place on the delivery of each requirement; it is also known as MoSCoW prioritization or MoSCoW analysis.
The term MoSCoW itself is an acronym derived from the first letter of each of four prioritization categories (must have, should have, could have, and won't have), with the interstitial O’s added to make the word pronounceable. While the O’s are usually in lower-case to indicate that they do not stand for anything, the all-capitals MOSCOW is also used.
Using the MoSCow technique I have categorized and arranged what the app must have, should have, could have and won’t have. It gives me a clearer picture and if I get stuck further down the development I can come back to this stage and get my head straight. From this list I will chose three features that I would like to work with defining task flow and user flow.
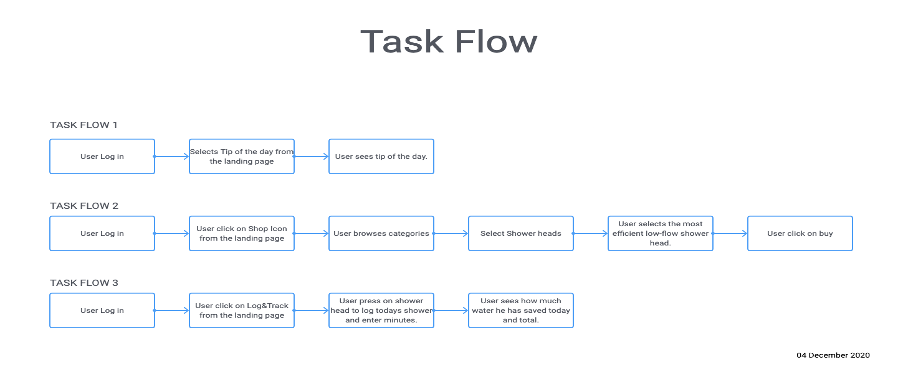
Task flows
I’ve created 3 Task Flows to show how our primary persona will interact with our app.
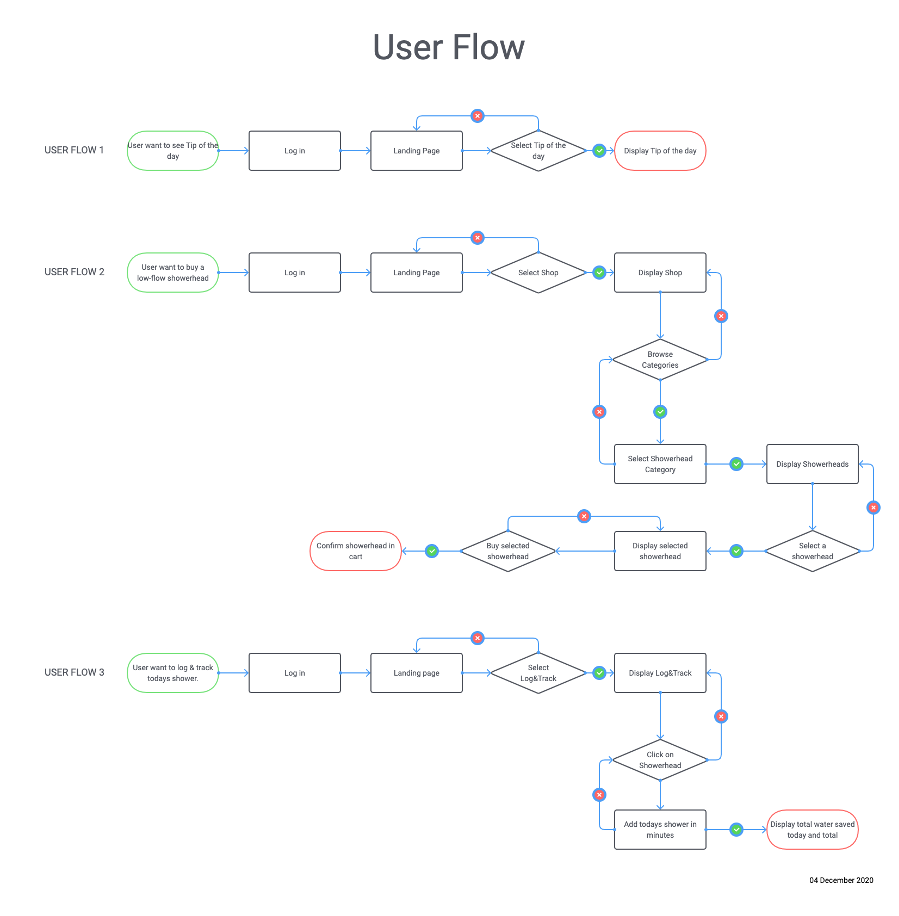
User flows
Here I have made 3 User Flows based on the Task Flows.
Tip of the day
Our app will give you a tip of the day. It is specifically designed for our user and their consumption and will give practical tips to how they and their household can save water and money.
Water Charities donation*
A section where our users can donate to pre-screened charities worldwide (NGO’s) that are doing an invaluable job in the fight against the water crisis.
Water World map
Dive into planet blue and see for yourself how we and the users are contributing to projects and conservation around the world.
Social media integration
Connect so you can share your activities across multiple social media channels..
Log & track your consumption*
This feature encourages the user to log and track his or her daily consumption. This is to create awareness and give the users a fun way to keep tabs with their consumption and compete with friends and family.
Water-o-rama!
A fun water meter section where our users can check out how much water they have saved in total, by country, by city and by neighborhood.
Water World dating
As you mum told you: birds of a feather flock together! People of similar character tend to associate. So why not try to bring our users together.
The water shop*
In our shop you can buy products that reduce water consumption. Our shop makes our app possible and free.
The Water World Community*
A global forum for our users where they can get together to discuss all matters relating to water. Our moderators will contribute to valuable information and monitor the forum to help and advice our users. The mission is to benefit from technology and connecting a worldwide audience so people can learn from each other.
Kids Korner
The children are the future and this section helps our users to teach our kids about water and awareness around water conservation in a fun way.
The water calendar
Our event calendar that shows all the events in your area and worldwide.
The water rewards
Earn Water Points on your purchases, donations and activities. All sections marked with * lets you earn Water Points, which you in turn can use to purchase from our shop, donate to charities or fund your own neighbourhood project.
After finishing the three task flows and three user flows I have selected to continue with task flow #3 and user flow #3.
Norman’s Tree Levels of Design
Donald Norman, one of the pioneers of usability design wrote the book Emotional Design where he talks about what is now known as Norman’s three levels of design. Here is an overview. These three levels are subjective for people because it interacts with our emotions so to describe them purely objectively is not seeing the whole picture. I shall therefore write about the different design levels both objectively and subjectively. For more information please check out this link: https://www.interaction-design.org/literature/topics/emotional-design

Visceral Design
Visceral Design is about the perceived qualities of a product or an object. It is a kind of gut feeling you get. Very emotional response and usually on a subconscious level.
It is almost twenty years ago but I still remember how giddy I was when I bought the brand-new iPod. In some ways my brain was a bit in shambles since I was an old-school DJ strictly playing LP records. I had a Sony Minidisc player I really loved since it was so portable but I stayed clear of all MP3 players on the market that came, until the iPod came.
It was gorgeous design, on par with the sleek products of Bang & Olufsen. The all white front with the sleek white earphones was marvelous. It was in retrospect very heavy but it did fit in my front pocket and I was ecstatic.
Behavioral Design
Behavioral Design is how the usability of the products or object makes the user feel. Is it ease of flow, is there any pain points? Does it make the user happy, or frustrated?
When I was a small child I loved to be in my father’s home-based office. He was an accountant and he had a couple of big calculators with paper rolls that made a really satisfying noise every time you punched in a number and then pressed enter. Just like a matrix printer it would make noise and you could hear the printer head in rapid succession punching the numbers on the paper. Those were the days. My dad’s electric typewriter was also a joy.
When I started working part-time for my father years later, he had moved on to a Dell PC with a quick laser printer. I remember punching text on the PC in MS Word and then printing the document. I hated it.
It kind of destroyed the good feeling and memories. Even today I dislike writing on computers and printing on Laser printers.
Reflective Design
Reflective Design is the highest model of emotion and design. At this level, we use information from both visceral and behavioral processing (i.e. the other layers) in combination with our knowledge and experiences.
First time Tinder came out on the market it was a very weird experience and a steep learning curve. It was as you were rewiring your brain. From the traditional heavy profile-based match sites to an app where you could sit anywhere and swipe yes or no. It was much more intuitive and more like the real life like going to a bar. People usually first apprach someone that they are attracted to. Now after many years Tinder really is not as much appealing anymore. I prefer to still go out to meet new people.
I would like to quote my teacher, David Chong on Reflective Design.
He explains it really well: Reflective Design is the highest level of emotional design, allowing the user to rationalize and intellectualize the product or object. When designers apply reflective design, the main goal is to tell a story about it and that it appeals to the user’s self-image. It allows the user to reflect on their use of the product or object before, during and after their experience.
Applying Norman’s Three Levels of Design
Implementing Norman's three levels of design for our Water World application is a challenging task. Designing a smartphone application is often more complex than creating a physical, tangible product, where you have full control over both the physical aspects and the user interface. Eliciting an emotional response through visceral design in a digital app can be particularly difficult.
However, our app is not a typical commercial product solely aiming to generate profit for shareholders. The Water World App is designed to raise awareness about the significant amount of water wasted in modern society. Its purpose is to enhance knowledge and awareness of water conservation on both global and local levels.
By gently encouraging our users to save water daily in simple ways, we establish credibility. Our status as a non-profit organization (NGO) further enhances this credibility, making it easier for users to trust us—especially when shopping via our online store, where we exclusively sell products that help reduce users' water footprints. In my view, the altruistic mission behind our product is inherently appealing and will evoke an emotional response.
We should offer a comprehensive onboarding tour of our app upon download and launch, allowing users to easily see what we offer without requiring registration.
If we succeed in getting users to register with us, we have partially achieved the goals of behavioral design. By convincing users that increasing their knowledge and taking small steps to reduce their water footprint can make a real difference, we create a bond with them. If they purchase items from our store—such as a water bottle that donates clean drinking water to those in need—we have effectively employed behavioral design principles.
As users begin to save water and gain more knowledge from us, we hope to influence and change their behavior. We have a significant advantage: our app genuinely contributes to making the world a better place. Over time, users will realize that by using our product, they are personally helping to reduce their water footprint. As the saying goes, "Little strokes fell great oaks."
By successfully changing user behavior, we forge a strong bond with them. Users feel proud of their contributions and are likely to share their experiences with friends, family, and colleagues. Through this process, we achieve the reflective design aspect described by Don Norman.
Log in and log your shower.
Click on User name.
Click on Password.
Click on Log in.
Navigate to Log, there are two ways to get there.
Log 5 minutes of shower you took today.
Confirm
Prototype
Testing
Formative Evaluation
Formative refers to which aspects work and which don’t work in your design, and why. This includes heuristic reviews, cognitive walk throughs, and usability testing. These methods help you understand what specifically is working or not and why. Using 5 users is enough for formative evaluation. This is frequently used throughout the Design Thinking process, and is supportive of the iteration process to create a better product overall. If you want to quickly learn how your product can improve in design, use formative evaluation frequently as part of the early design process and employ it frequently.
Summative Evaluation
Summative evaluation tells you overall how usable your design is compared to competitors or a given benchmark. This is usually used when you have a complete design. Users perform tasks on your product, usually unassisted, then the users grade your product on a predefined grading scale against predefined criteria, for example: Satisfaction level and ease of use. This measures how usable or satisfying the experience is. A large sample of users is needed. Use summative evaluation when you are able to sample a large user group and the product is complete, and if you want to understand how it is performing generally.
I have opted for Formative Evaluation as we are still in the Design Thinking process and may need to go back to iterate. By using only five users, we can quickly get a Qualitative Testing And I can take the users feedback to alter and improve the design.
This takes me over to Behavioral Research. Since I will have 5 users to test our low-fi wireframe based on Task Flow #3 and User Flow #3, I can with Behavioral Research observe our users’ actions and interact with our users, so they are not in the dark.
Since I do not want to keep our users in the dark but want to interact with them, so they can open up and get them to talk and share their views, we opted for scripted testing. It is a great way to bond with the user and make them trust me, the facilitator.
In order to understand the user, the best way possible I opted to conduct Moderated, In- Person interviews. This is known as Lab Usability Testing. I personally feel that by being with the subject I can create a trust relationship and I can study their body language and see how they react. It gives me much more information.
Usability Testing Script
After deciding which path to choose I started working on the Usability Testing Script. It is based on a template I got from my teacher at Noroff Vocational School. Please see the Appendix section at the end of the document.
Participation Selection & Recruitment Process
I selected 5 users to participate for usability testing. I have chosen the five from the users we surveyed in our Research & Planning phase:
User 1: Female (40) – Yoga Therapist
User 2: Male (37) – Restauranteur
User 3: Male (40) – Chef
User 4: Female (26) – Receptionist
User 5: Male (45) – Airline employee
Warm up questions:
1. What is your name?
2. Select your gender?
3. How old are you?
4. What is your occupation?
5. Where do you live?
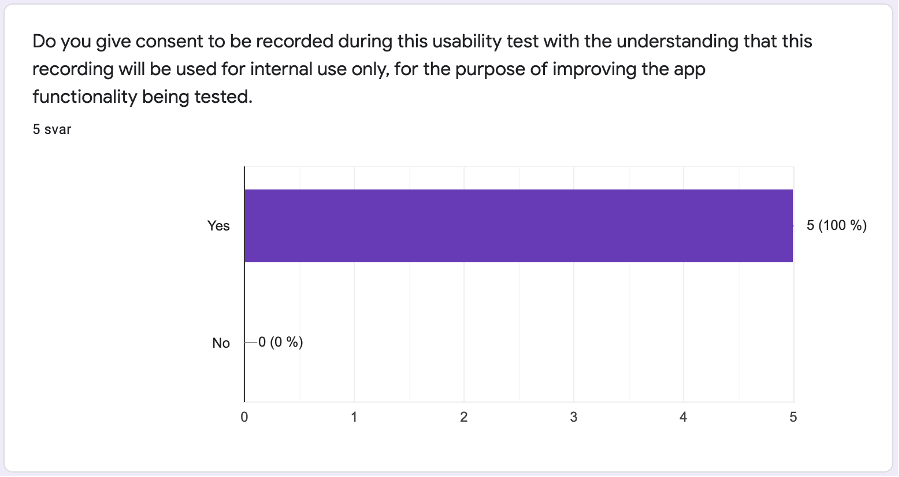
Consent and Protecting the User’s Personal Information
In order to protect the user’s privacy, they had to sign off on a google form. I informed them at that I would record audio and
the screen on the computer while they were doing the Usability testing. All the users have signed it. You can get it here:
https://docs.google.com/forms/d/1KTKy4M9oCfa0aoCVztLCkumESHcW3Slnh8vrAIQSKnY
Data Analysis Technique
After conducting the interviews with my 5 users. I gathered all their feedback. Please note that the interviews were
conducted in Norwegian and I have translated them to English. You may find all five recordings here:
https://www.icloud.com/iclouddrive/0WB0zKenJu38u0D8RJynySwkQ#UsabilityTesting-Water_World
Interviews (Answers Collected)
Here are the answers collected during the interview with the users. You may access the usability test here:
https://t.maze.design/23736189?guerilla=true
User 1:
Pointed out that there should be badges when you hit milestones.
User would like a water challenge so people can compete with themselves.
Good design
Easy to use
User 2:
Question 2 was a bit confusing.
User pointed out that the app was very simple and easy to use. The design looked familiar so it was like muscle memory and easy to navigate.
Would like to have more options for logging other water related activities.
Asked if there were any prizes or rewards. He gave an example: If user logs 10.000 liter water saved he should get a badge and some info about 10.000 liter would give so many people clean drinking water in the third world for how long period.
User 3:
Super easy to use. Very clean layout
He said that even his mum and dad could probably use it.
User 4:
Very clear and simple design. Says it was quick and easy to log use of shower. Great design so even if tired in the morning with no coffee she would manage to use the app.
Asked for feature: Target. Example how many minutes showered in a week. How much water used. She said it should be targets like a
Asked for info about what are the consequences of me taking shorter showers? People don’t know so much about water saving here so they need to get educated and get a morale boost by saving water.
Liked the app very much and would use it.
User 5:
Easy to use
Couldn’t see anything missing.
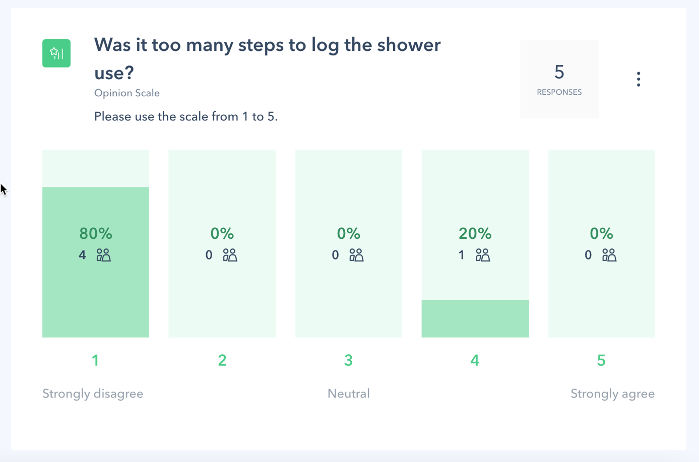
Would prefer that the shower minutes were 5 minutes interval instead of 1-minute interval. Said no one logs 3 or 7 minutes. They log 5, 10 or 15 minutes.
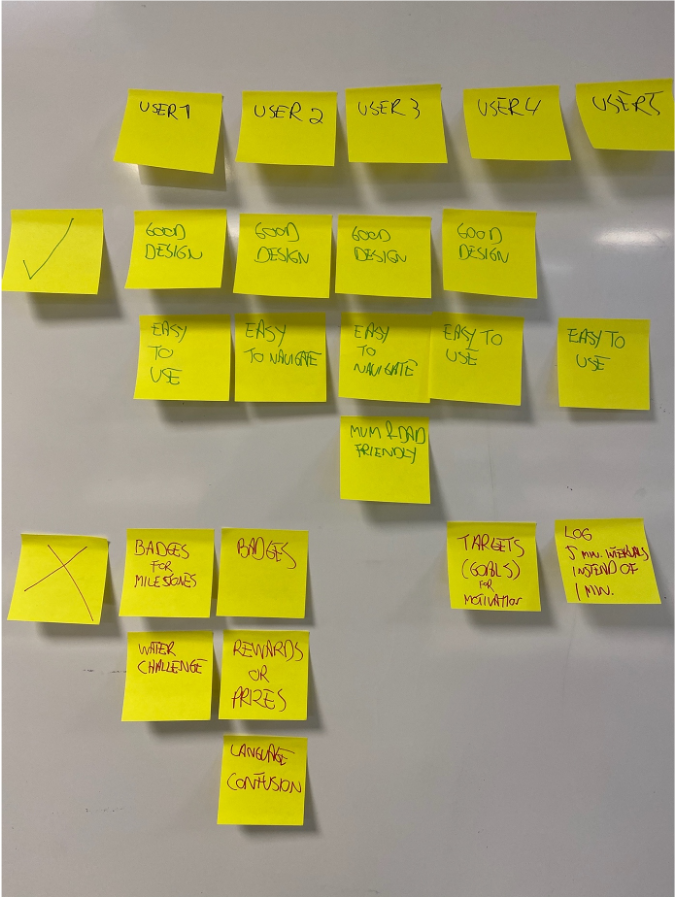
Affinity Mapping
As the users were quite different from each other I started organizing using affinity mapping. The image below shows how I compiled them into meaningful answers.
Usability Test Report
Usability test report is available here: https://t.maze.design/23736189?guerilla=true
I’ve made a clear task for my users (called mission)
Your goal for this test is the following:
Log in to the app
Go to the Log section
Go to Log Shower
Log shower (5 minutes)
Confirm
Here are the results gathered for the mission:
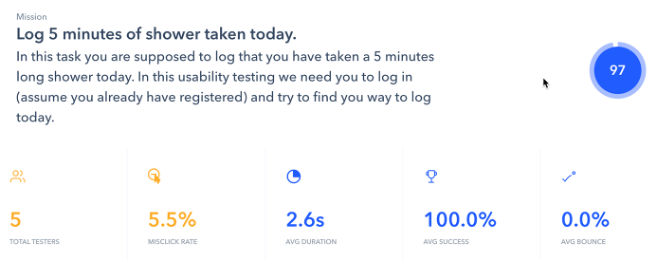
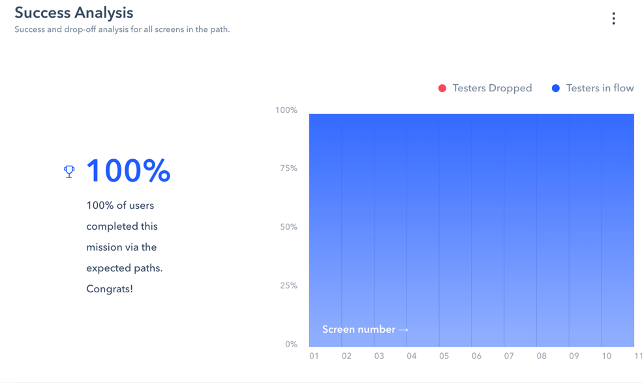


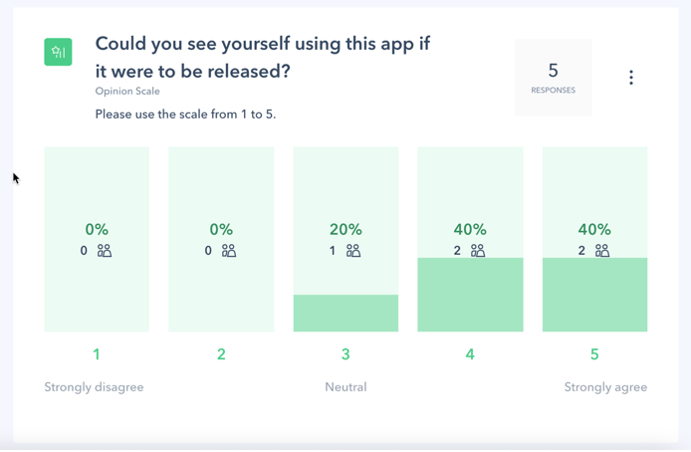
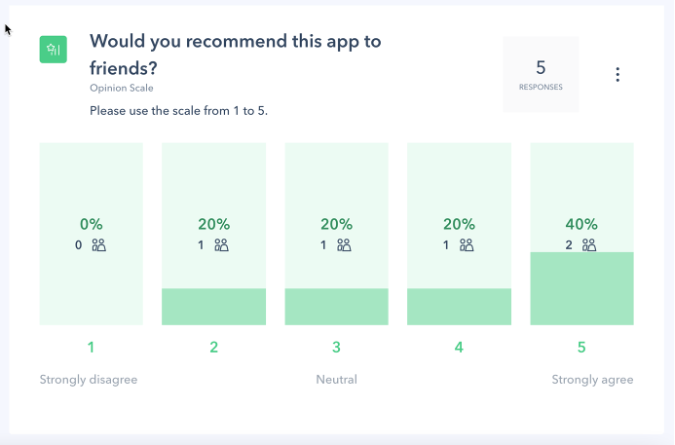
As you can see by the data collected all the testers had no problem successfully navigating through the wireframe and with the feedback gathered I am happy that the design I have created is working and no major rework is needed.
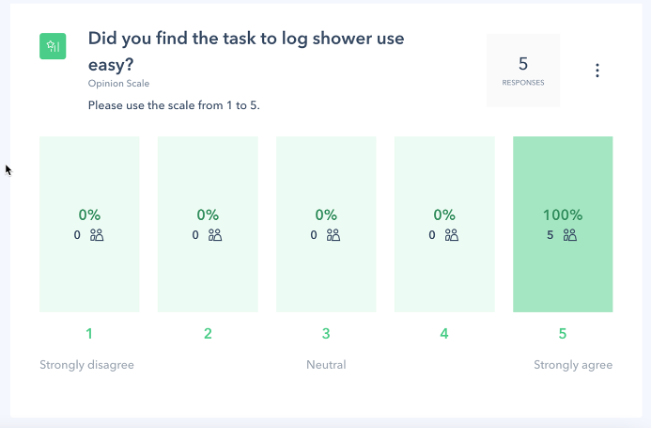
User Feedback
After the users tested the app I had a follow up questionnaire so I could see how they reacted to my design:
Findings Based on The Interviews and Usability Testing
Although the feedback from the users have been overwhelmingly positive they asked for some features. While those features are not something that is required in showing the task flow, they yielded great insight in the minds of how the users think and I learned a couple of things and got some great ideas from them which I will include in the final wireframe.
I also have to take self-critique about a couple of things I should have been more careful about. In one of the questions I used confusing language. I also did not explain good enough to my testers about the concept of low-fi wireframe and how it is just a dummy, not a working prototype. I especially saw this when the testers tried to enter username and password (even though I never gave them any username and password). It just shows that the slightest of misinformation or omission of information can lead to problems.
So, in hindsight I will prepare a proper fact sheet to my testers where everything is quite detailed so they have a kind of userguide before they conduct the test. This in my opinion will solve the problem.
In the end I came up with these improvements to implement in the wireframe design:
1. Badges (for milestones).
2. Rewards showing after logging of shower.
3. Remove Tour at the beginning of app since in the task flow user is going to only log in.
4. Added Rewards, Milestones and Badges in the menu.
Data Analysis Technique
After conducting the interviews with my 5 users. I gathered all their feedback. Please note that the interviews were
conducted in Norwegian and I have translated them to English. You may find all five recordings here:
https://www.icloud.com/iclouddrive/0WB0zKenJu38u0D8RJynySwkQ#UsabilityTesting-Water_World
Interviews (Answers Collected)
Here are the answers collected during the interview with the users. You may access the usability test here:
https://t.maze.design/23736189?guerilla=true
User 1:
Pointed out that there should be badges when you hit milestones.
User would like a water challenge so people can compete with themselves.
Good design
Easy to use
User 2:
Question 2 was a bit confusing.
User pointed out that the app was very simple and easy to use. The design looked familiar so it was like muscle memory and easy to navigate.
Would like to have more options for logging other water related activities.
Asked if there were any prizes or rewards. He gave an example: If user logs 10.000 liter water saved he should get a badge and some info about 10.000 liter would give so many people clean drinking water in the third world for how long period.
User 3:
Super easy to use. Very clean layout
He said that even his mum and dad could probably use it.
User 4:
Very clear and simple design. Says it was quick and easy to log use of shower. Great design so even if tired in the morning with no coffee she would manage to use the app.
Asked for feature: Target. Example how many minutes showered in a week. How much water used. She said it should be targets like a
Asked for info about what are the consequences of me taking shorter showers? People don’t know so much about water saving here so they need to get educated and get a morale boost by saving water.
Liked the app very much and would use it.
User 5:
Easy to use
Couldn’t see anything missing.
Would prefer that the shower minutes were 5 minutes interval instead of 1-minute interval. Said no one logs 3 or 7 minutes. They log 5, 10 or 15 minutes.
Affinity Mapping
As the users were quite different from each other I started organizing using affinity mapping. The image below shows how I compiled them into meaningful answers.
Usability Test Report
Usability test report is available here: https://t.maze.design/23736189?guerilla=true
I’ve made a clear task for my users (called mission)
Your goal for this test is the following:
Log in to the app
Go to the Log section
Go to Log Shower
Log shower (5 minutes)
Confirm
Here are the results gathered for the mission: